ENVIRONMENT

CLEAN VALUE CHAIN IN FISHERIES

Environmental issues pose one of the greatest challenges to the fisheries sector. The pollution of the sea is a direct threat to the results of the fisheries sector in Iceland. Brim will seek any means to reduce pollution from its own operations and continue to develop its operation toward sustainable fishing and processing.

In 2015 Brim initiated an extensive environmental project under the title “Cleaner Value Chain in Fisheries”. Under that plan, Brim has worked systematically to record the company's environmental impact throughout the value chain from fishing to markets. On this basis, work is underway to develop new technologies and methods for managing the ecological footprint of Brim’s products from fishing to market delivery.

All environmental information relating to the operation of the company is digitally streamed from its place of origin into an environmental database. Whether the activity is at sea or on land. The database makes the information accessible to the company’s employees for the purpose of using the information systematically for actions that have the purpose of reducing the environmental impact. Part of the software ensures that Brim can fulfill environmental legislation as current and can also provide the authorities with access for digital monitoring. Although the software was brought into use in June 2016, it will continue to be developed, and its implementation within the company is presently in full swing.

The project includes the following main aspects:

  • Ensuring knowledge development of all the aspects of environmental impact from the operation of the company throughout the value chain, from fishing to the market.
  • Systematically reducing the negative environmental impact of the company’s operations.
  • Reducing the formation of waste and ensuring better sorting of waste.
  • Ensuring quantification and goal setting in environmental matters.
  • Improving operations and responsibility with respect to the environment.
  • Supporting Iceland’s national goals as regards climate issues.

This involves the use of technological knowledge to develop at Brim new and improved processes that will revolutionize the ability of the company to manage its operations in tune with goals in the field of environmental and energy management.

.

FUEL

Fuel use by the vessels of Brim has been significantly reduced following mergers with a number of fisheries companies since 1985. The restructuring has meant that well over 10 vessels have been removed from operation. Brim had eight vessels in operation in 2020 along with one hook-and-line boat, a total of nine, which this is the same number as operated in 1985. These mergers have meant that the company’s quota has almost tripled even though the number of vessels has not increased. Less fuel use results not least from the strong fisheries management system that has had the result of building up strong fish stocks. There have been comparable developments among other fisheries companies throughout Iceland.

Fewer and more efficient vessels utilize fuel better than before; with the renewal of the fleet, Brim has completely discontinued the use of heavy fuel oil and at the same time increased the use of more eco-friendly energy sources such as connecting vessels to land-based electricity and heating utilities when they dock. The same applies to the company’s fish meal plants, which were previously run on fossil fuels but are now for the most part run on electricity. This is also true of other processing plants on land, which have long been run on electricity and have been developed to fully utilize all raw materials, minimise waste and generate increased value at the same time.

Extensive technological advancements have been made over recent years, and considerable new knowledge and expertise has been gained in the fisheries industry. In addition, there has been considerable progress in fish-finding technology, developments of fishing gear, fishing techniques and the handling of catches on board vessels. For these reasons, and the improved condition of fish stocks and larger vessels, the catch-per-unit effort (CPUE) has almost tripled during the period.

Fuel use

FUEL USE OF SHIPS AND FISHMEAL PLANTS FROM 2005-2020

ENVIRONMENTAL IMPACT OF VESSELS ON CATCHES

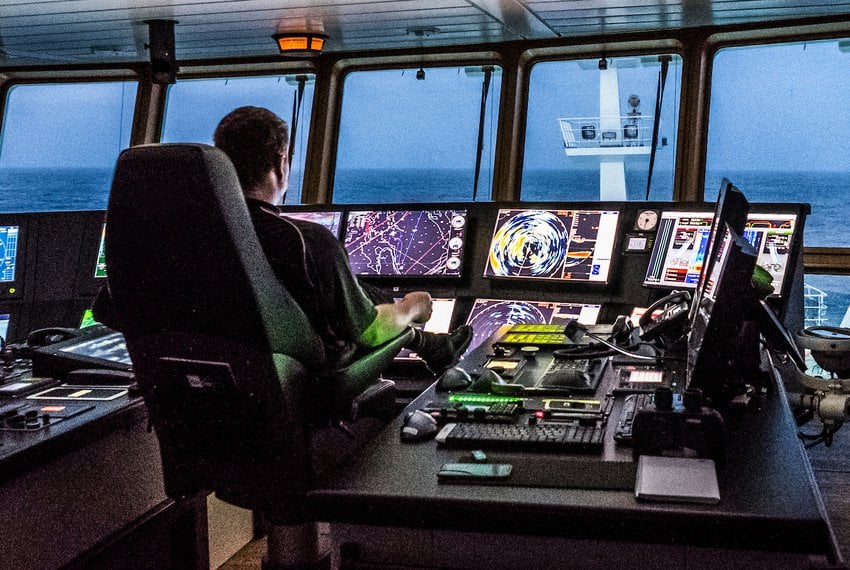
The greatest environmental impact of the operation of Brim is due to the fuel use of the fleet. In recent years, the company has systematically worked on analysing carbon footprints from fishing to processing, together with increased use of environmentally friendly ships’ fuels. It should be noted that a number of variables can affect the calculation of fuel use, such as the composition of catches, catches and fishing patterns of individual vessels, as well as the weather. It is important to take these factors into account when concluding results based on figures published here and comparisons between years.

The total use of the fleet during the year was almost 22.5 million litres, which emitted 60 thousand tonnes of CO2 equivalents, catching 128 thousand tonnes. This is approximately 82% of the total emissions of the company, which is 78 thousand tonnes. All Brim vessels now use MGO or DMA fuels which have a sulphur content of 0.1%.

  • The share of the wetfish trawlers of CO2 equivalents emitted is 16 thousand tonnes, or approximately one-fourth. When the energy intensity of fishing is measured, i.e. how many litres of fuel are required to catch one tonne of fish, the wetfish trawlers are seen to use 281 litres. This is 801 kg of CO2 equivalents per tonne.
  • The share of the freezer trawler in carbon emissions during the year was more than 27 thousand tonnes of CO2 equivalents. Energy intensity for fishing on freezer trawlers is somewhat greater, or 350 litres for each tonne. This is 996 kg of CO2 equivalents per tonne.
  • The carbon emissions of pelagic vessels during the year was over 21 thousand tonnes of CO2 equivalents. The energy intensity of fishing was 89 liters of oil per tonne, or 255 kg of CO2 equivalents.

ENERGY INTENSITY OF FISHING VESSELS

CO2 EMISSIONS OF FISHING VESSELS PER CATCH UNIT

Numerous variables can affect the fuel use of vessels, most notably

  • State of fish stocks.
  • Composition of catch.
  • Fishing patterns and distances.
  • Weather.

It is important to take these factors into account when concluding results based on figures published here and comparisons between years. When comparing fuel use between years, it should be mentioned that blue whiting fishing was harder in 2020 than the previous year because of difficult weather in the first three months of the year. We also had to go further for mackerel. Catch for wetfish trawlers was reduced from the previous year due to weather. They were not fully utilized last summer due to the renovations of the processing plant at Norðurgarður, but catches are usually very good in the summer.

FUEL USE OF FISHMEAL PLANTS

The company’s fishmeal plants, previously run on fossil fuel, are now for the most part electrified. Every effort is made to use electricity instead of fuel when availability allows. The fuel use of fishmeal plants increased from 348 thousand litres in 2019 to 464 litres in 2020, an increase that can be traced to a reduction in unsecured energy from electricity sellers. This year DMA fuel (distillate marine A) was used exclusively, which has a 0.1% sulphur content.

Fuel use per produced tonne of fishmeal from the company’s plants increased between years and went from 4.6 litres/tonne to 6.2 litres/tonne in 2020. The reason was a reduction in electricity on unsecured energy from the electricity seller to the plant in Vopnafjörður.

The total carbon emissions due to fuel use from the company's plants in 2020 were 1,327 tonnes of CO2 equivalents.

The company's goal is to use environmentally friendly fuel. Through agreements for competitive electricity prices to fishmeal plants, we can expect the share of electricity use to increase even more at the expense of fuel use in the future.

TOTAL ENERGY INTENSITY OF FISHMEAL PLANTS

PROMOTE INCREASED USE OF RENEWABLE ENERGY

Icelandic fish meal and oil processing manufacturers have, over past decades, used both fossil fuels and electricity in their operation. In recent years, fishmeal producers have purchased controllable transmission and distribution of electricity. Due to the limited security of transmission and distribution in the electrical system, insecure availability of electricity and fluctuating demands from fish meal processors, fossil fuels have been a necessary back-up source of power in the operation and have replaced electricity when needed. To achieve full electrification, however, significant investments will have to be made in the electricity transmission system in Iceland.

Félag íslenskra fiskimjölsframleiðanda (FÍF) has signed a declaration of intent and entered into an agreement with Landsnet, Rarik and HS Veitur on one hand, and Landsvirkjun on the other, with the goal of promoting increased use of electricity in processing. Thereby reducing the use of energy sources that emit greater carbon footprints and at the same time, increase the likelihood that the goals of the Paris Convention and the action plans of the Icelandic government as regards climate goals will be achieved.

Landsvirkjun's and FÍF's first declaration of intent to promote the continued use of renewable energy in the fishmeal industry was valid from March 2017 to the end of year 2019. During these three years (2017-2019), 584,125 MWh of electricity was used, thus saving the combustion of 56.5 million liters of oil. This reduced the carbon emissions of the fishmeal factories by 168 thousand tonnes of CO2 equivalents. Brim’s share of the total fuel use was 108,991 MWh or 18.66%, which saved the combustion of 10.5 million liters of oil. As a result, the company's carbon emissions decreased by 31 thousand tonnes of CO2 equivalents during the period.

It was decided by signature on June 22, 2020 to extend the previous declaration, as the parties agree to continue working towards the goals described in the previous declaration by Landsvirkjun contributing as much as possible to an increased supply of controllable energy, and to that aim, Landsvirkjun has submitted an application for an exemption to the Competition Authority. FÍF will also continue to encourage members to use renewable energy sources in their operations.

A declaration of intent between FÍF and Landsnet, Rarik, HS Veitur, on electricity transmission and distribution, where the parties will work together toward improvements in climate issues with more efficient use of investments and infrastructure in mind, was signed in 2018 and is still valid.

CARBON TAX ON FUEL

The government’s aim with the imposition of a carbon tax is to harmonize the taxation of fossil fuels with the aim of encouraging energy exchange, reducing greenhouse gas emissions and systematically contributing to energy savings in all areas. The carbon tax is a tax levied on all fossil fuels and is calculated on the basis of each liter of fuel. Thus, the amount of the carbon tax for the year is ISK 11.45 per liter of gas and diesel oil for vessels The comparison shows that from 2015 to 2020, the carbon tax on fuel use has almost doubled.

Carbon tax Units 2020 2019 2018 2017 2016 2015
Carbon tax, gas and diesel oil ISK/liters 11,45 10,40 9,45 6,30 6,00 5,84
Carbon tax, petrol ISK/lítra 10,00 9,10 8,25 5,50 5,25 5,10
Carbon tax, fuel ISK/kg 14,10 12,80 11,65 7,75 7,40 7,23
Carbon tax, crude oil, etc. ISK/kg 12,55 11,40 10,35 6,90 6,60 6,44
Total carbon tax þ.kr. 263.643 255.588 197.427 127.043 138.451 139.087

VEHICLES AND EQUIPMENT

Fuel use of vehicles and equipment is insignificant when compared to that of vessels and plants. It decreased in the period 2019 to 2020 from 47,861 liters to 44,430 liters. A total of 21 vehicles were in operation, a decrease of 1 between years. Brim plans to increase the use of electric vehicles and hybrid cars over the next few years. At the same time, the company has installed charging stations for the vehicles of the company, its employees and guests.

EMISSIONS OF CO2 RESULTING FROM BRIM EMPLOYEE TRAVEL TO AND FROM WORK IN REYKJAVIK

Brim hired the engineering firm Efla to update a report on CO2 emissions due to travel by employees in Norðurgarður to and from work for the year 2020. As before, travel attributed to employees was categorised according to post codes and the assumption made that each employee at Norðurgarður (offices, processing plant and freezer storage) would travel to and from work five days a week for 48 weeks a year. No other travel undertaken by employees during working hours was included, although it is assumed that other travel balances out, for example, other days when the employee does not come to work, e.g. due to illness. The transport agreements of the employees were taken into account in these calculations.

In order to estimate emission, information on vehicle types was collected and an assessment made of the average fuel consumption of each vehicle. The range of vehicle types as regards energy source, i.e. petrol, diesel and electricity, was estimated according to figures provided by the Transport Authority, and it was assumed that figures for the country as a whole were descriptive of the private vehicles of the employees of Brim. Thereafter, information was collected on the emission standards of these three energy sources, together with their density. It is assumed that there are no CO2 emissions from the use of electric cars.

Emissions for the year 2020 were 144 tonnes of CO2 equivalents compared to 173 tonnes of CO2 equivalents in 2019. Production at Norðurgarður was closed for three months due to renewal, which explains the contraction. These figures are entered in the company's environmental results.


Efla's report: Traffic and emissions due to Brim’s employees in 2020

THE IMAGE SHOWS THE RESIDENCY OF EMPLOYEES ACCORDING TO POST CODES


Hlutfall búsetu 2020 V2.jpg


ELECTRICITY

In 2020, Brims' electricity use was 49,065,946 kWh, or slightly less than in 2019, when the use was 50,231,379 kWh. Electricity use of fishmeal plants decreased in both these years due to capelin catch failures.

All electricity purchased by Brim is renewable energy. It is important, therefore, to use electricity instead of fossil fuels whenever possible. The main opportunity that Brim has in this respect is to use electricity instead of fossil fuels in the production of fishmeal. In addition, there is the possibility of connecting all the company’s fishing vessels to land-based electricity when they are tied up in port.

The attached document confirms that the source of electricity used by Brim in 2020 was 100% renewable.

Brim_GOs_ES_2020.pdf

ELECTRICITY USE OF OPERATION UNITS

NEW QUAY AT NORÐURGARÐUR WITH ELECTRICITY AND HEATING UTILITIES CONNECTIONS TO VESSELS

To reduce the use of fossil fuels and promote the use of green energy sources, Brim renovated the quay at Norðurgarður in 2018. The quay is a steel quay 120 m long and 20 m wide with a concrete surface containing a snow-melting system that uses the runoff water from Brim’s fish processing plant.

This change greatly improves all port facilities for the company’s wetfish trawlers. The quay that preceded it was an old wooden pier that had seen better days. The new and larger quay ensures access to new and powerful land connections to electricity and hot water. Now all the wetfish trawlers of the company can connect to environmentally friendly energy when the vessels are in port at Norðurgarður.

The facilities at Ísbjörninn are connected to environmentally friendly power sources which the freezer trawlers use, but not to hot water. In Akranes, there is both electricity and hot water for vessel land connections. No land connection for electricity or hot water is available in Vopnafjörður, but there are opportunities to reduce fuel use with changes to the port in Vopnafjörður.

ELECTRONIC LOGBOOKS IN VESSELS

As of 2015, Brim, in co-operation with Klappir, the Icelandic Coast Guard and the Environment Agency of Iceland, has participated in the development and adoption of electronic administration on board its vessels. To date, mandatory registrations on board vessels as regards environmental effects have always been on paper. These include registrations of waste disposal, fuel use and the use of ozone-depleting substances (ODS) in a paper logbook according to the MARPOL Convention of the International Maritime Organisation (IMO). The goal was to turn these books into e-books and thereby take a large step forward in the field environmental management.

Brim can now take advantage of the data stored in the logbooks for environmental management and can gain an overall picture of all its vessels’ environmental aspects, as well as remotely monitor registrations. Regulators, e.g. the Icelandic Coast Guard and the Environment Agency of Iceland, can now undertake their statutory surveillance role electronically and thereby minimise the cost and effects that monitoring registrations has on the operation of vessels. Data from the logbooks is streamed to port authorities who are responsible for their statutory role of accepting delivery of waste.

At present, all Brim vessels have digital logs to register pollution factors according to MARPOL Annex I-VI. To ensure accurate registration of fuel purchases for the vessels, a digital order system is used that is connected to MARPOL Annex VI.

REFRIGERANTS

In accordance with SFS's environmental policy signed by Brim, Brim will replace refrigerants with refrigerants that do not cause a greenhouse effect at the first available opportunity. Emissions from refrigerants are 2,834 tCO2 equivalents in 2020. Brim's goal is to have completed the replacement of refrigerants for more environmentally friendly refrigerants by the end of 2025. When building and renovating ships, emphasis is placed on environmentally friendly refrigerants.

WASTE

The proportion of sorted operational waste in 2020 was 82%, compared to 79% in 2019. There was a considerable increase between years in the total amount of waste related to the renovation of the groundfish processing plant at Norðurgarður. Brim has set itself the goal of achieving a 90% portion of sorted operational waste by 2025.

The waste sorting project began ten years ago in Vopnafjörður on the initiative of the employees, and today Brim owns and operates three fully equipped sorting stations. These three sorting stations, Bragginn in Vopnafjörður, Kistan in Akranes and Svanurinn in Reykjavík, are fully equipped sorting stations where digital solutions are used as regards the recording of both general waste and recyclable material.

The company sorts all waste, whether generated at sea or on land, and recycles to the extent possible. In recent years, Brim has organised extensive sorting and environmental operations with the goal of minimising the volume of the company’s waste sent to landfills.

Brim regards sorted waste as raw materials for other processing. Methods for recycling sorted waste are constantly being developed. Almost all plastic generated by Brim today is recycled, for instance.

Information on waste disposal continued to be streamed electronically into the environmental records of the company during the year by executing all daily disposal of waste electronically using smart scales and smart containers.

PROPORTIONS OF SORTED WASTE FROM OPERATIONS

TOTAL VOLUME OF WASTE

SMART CONTAINERS - SMART SCALES

A “smart container” is used for general waste, which is sent for the most part to landfills. All waste put in the container is registered to the department responsible for that waste. The container is equipped with scales that return information on the volume of waste to the environmental database of the company. The first smart container was used in August 2017 in Kistan, Brim’s sorting station in Akranes. Smart containers and smart scales had been installed in all Brim sorting stations by the beginning of 2018.

All recycled raw materials are sorted according to a defined sorting system. Each recyclable category is weighed by “smart scales” and labelled with its processing path in the environmental database of the company. Waste was sorted into 34 categories in 2020. The main recycling categories are pure iron, corrugated paper and other paper, wood and mixed metals. In addition, there are two categories for general waste. i.e. general waste and coarse waste.

Brim employs specially trained employees who work under the best conditions in the operating units of the company at specially equipped sorting stations.

DISPOSAL OF FISHING GEAR WASTE

Hampiðjan receives all fishing gear waste from Brim. The crews of the company’s vessels or the employees of the sorting stations cut off various parts that can be reused. Hampiðjan cuts off the usable parts that remain. The unusable material sections are set apart and sent to landfills in Iceland. Hampiðjan sends all recyclable fishing gear waste overseas, where it is sold to foreign recycling stations.

The recycling stations wash the fishing gear waste and grind it into small particles that are then sorted automatically. The final product is raw material used to make plastics. Trawl wires are chopped into ground cables that Brim reuses.

Hampiðjan works closely with Fisheries Iceland (Samtök fyrirtækja í sjávarútvegi, SFS) and submits to SFS figures on the exported volume of fishing gear waste from Brim and other fisheries companies. SFS then forwards the information to the Recycling Fund according to an agreement with the Fund. SFS has an agreement with the Recycling Fund under which the association is responsible for ensuring that waste fishing gear made of synthetic materials is recycled. At the same time, authorisations for exemptions from recycling fees levied on fishing gear made from synthetic materials are utilized.

There were no mishaps during the year where fishing gear was lost at sea.

PROPORTION OF SORTED OF FISHING GEAR WASTE

Disposal of fishing gear waste in 2020 Unit
Type of fishing gear kg Recycled and Reused Sent to Landfill Total
Trawls PE/PP/PEP 62.150 - 62.150
Pure Seine PA Multifilament 10.000 21.680 31.680
Net rods and cables PES/PE/PA - 25.160 25.160
Rockhoppers - 35.600 35.600
Scrap metal 20.000 - 20.000
Total kg 92.150 82.440 174.590

DISPOSAL OF WASTE OIL

All Brim vessels regularly produce waste oil that is sent for recycling to Olíudreifing ehf. and Skeljungur hf. Olíudreifing and Skeljungur are contractors for the Recycling Fund for the collection and recycling of waste oil according to an agreement with the Recycling Fund, and the operation is funded through a recycling fee that is levied on imported lubricants according to law.

Waste oil results for the most part from lubricant renewals in the engines of the vessels and also, to a lesser extent, from fuel oils and hydraulic fluids. It is recycled and sold as factory fuel. This waste oil is collected by the vessels into a special tank located on board the vessels and is managed by the engineer. The tank is emptied as needed into a tanker that the recycling entity sends to the vessel when the tank needs to be emptied.

At the beginning of September 2020, the Environment Agency issued an Advisory Opinion on the recycling of waste for the production of so-called factory fuel made from waste oil. The opinion discusses whether waste ceases to be waste once it has gone through a certain recycling process. The conclusion of the Environment Agency is that the waste should be classified as a recyclable product after the recycling process as long as the process meets all the Agency's requirements. The aim of the agency with the aforementioned opinion is to promote a circular economy and a more sustainable use of resources where raw materials remain within the economy.

INTERESTING FACT!
This year, Brim was a founding member of the national campaign Þjóðþrif, taking the first steps to ensure that all plastic from the company is recycled. Of the 27 tonnes of plastic that was generated and went for recycling, a 40% share, or 11 tonnes of plastic, went to Pure North Recycling in Hveragerði.

TRANSPORT

Shipping of marine products to overseas markets is a major part of Brim’s operation. The table below shows the analysis of the carbon footprint due to the transport of fresh and frozen groundfish products to buyers in foreign markets. The exported volume of frozen and fresh groundfish products in 2020 was 22,565 tonnes. Total emissions from transportation amounted to 5,842 tonnes of CO2 equivalents, which is almost 7.5% of the company's total emissions.

CARBON FOOTPRINT BY MAIN GROUNDFISH SPECIES

Name Quantity tonnes Quantity kg% tCO2e tCO2e % Kg CO2e per tonne of product
Cod 7.663 34,0% 2.600 44,5% 339
Redfish 7.303 32,4% 1.781 30,5% 244
Saithe 5.004 22,2% 998 17,1% 199
Haddock 1.334 5,9% 150 2,6% 113
Lumpfish 616 2,7% 228 3,9% 370
Silver Smelt 356 1,6% 47 0,8% 132
Greenland Halibut 33 0,1% 4 0,1% 136
Other 256 1,1% 34 0,5% 135
Total 22.565 100% 5.842 100% 259

*The table shows average calculations per kg. CO2 equivalents of total volume of exported groundfish. The carbon footprint of individual species is determined by different processing methods, transport methods, delivery terms and market areas. It is important to take these factors into account when concluding results based on figures published here and comparisons between years.

**The calculators of Eimskip, Samskip, Icelandair, Pier2Pier.com and sea-distances.org are used to calculate the estimated CO2e.

When looking at the carbon footprint of the transport of individual fish species, it becomes clear that the largest carbon footprint is due to the transport of cod, redfish and saithe from the company's processing plant to customers. Exports of these three species amounted to 19,970 tonnes or 88.5% of Brims' total groundfish exports in 2020.

If the carbon footprint of these species is calculated for each kg CO2 equivalents per tonnes of product, this reveals that cod accounts for an average of 339 kg, redfish for 244 kg and saithe for 199 kg.

The export of 22,565 tonnes of Brim groundfish products emits, on average, approximately 259 kg of CO2 equivalents per tonne of product.

THE CARBON FOOTPRINT OF FROZEN AND FRESH GROUNDFISH PRODUCTS

Products frozen at sea Ship Air Total
Quantity tonnes 15.089 15.089
tCO2e 2.820 2.820
CO2 tonnes % 100% 100%
Products frozen on land Ship Total
Quantity tonnes 3.507 3.507
tCO2e 588 588
CO2 tonnes % 100% 100%
Fresh fish Ship Air Total
Quantity tonnes 3.355 615 3.969
tCO2e 405 2.029 2.434
CO2 tonnes % 85% 15% 100%
Total quantity in tonnes 21.951 615 22.565
Total quantity in % 97% 3% 100%
Total CO2 equivalent in tonnes 3.813 2.029 5.842
Total CO2 equivalent in % 65,3% 34,7% 100%

*Emission of greenhouse gases is usually measured in tonnes of carbon dioxide equivalents (tCO2e). A carbon dioxide equivalent is a unit of measurement that describes the volume of carbon dioxide that has the same GWP (Global Warming Potential) as a specific mix of other greenhouse gases. For instance, methane is equivalent to (CH₄) 28 CO2 equivalents and nitrogen oxide (N₂O) to 265 CO2 equivalents.

**The calculators of Eimskip, Samskip, Icelandair, Pier2Pier.com and sea-distances.org are used to calculate the estimated CO2e.

The proportion of total export by ship was 97% during the year, or 21,951 tonnes of products. The carbon footprint of shipping was 3,813 tonnes of CO2 equivalent or 65.3% of total emissions.

During the same period, air freight was 616 tonnes, or 3% of the total exported volume, and the emission of CO2 equivalents was 2,029 tonnes. This is 34.7% of the total carbon footprint for the transportation of Brim’s products to overseas markets.

It is quite clear that exports by ship are much more environmentally friendly than by air freight.

THE CARBON FOOTPRINT DUE TO EXPORT OF FROZEN PELAGIC PRODUCTS, FISHMEAL AND FISH OIL

With the calculation of the carbon footprint due to export of pelagic products to foreign markets as well as fishmeal and fish oil, Brim is now for the first time publishing a complete calculation of the carbon footprint of all of the company's products.

The exported volume of pelagic products during the year was 25,727 tonnes. Total carbon emissions from transportation amounted to 1,683 tonnes of CO2 equivalents, which is just over 2.2% of the company's total emissions. As information on the carbon footprint of pelagic products is now included in the company's environmental statement for the first time, this results in an increase in CO2 equivalents for the year 2020, compared with the previous years’ statements.

Fishmeal plants Tonnes tCO2e
Fishmeal and fish oil 20.032 970
Percentage of quantity and CO2 in % 78% 58%
Pelagic freezing Magn tonn CO2 tonn í gildi
Frozen products 5.695 713
Percentage of quantity and CO2 in % 22% 42%
Total quantity and CO2 in tonnes 25.727 1.683

*Emission of greenhouse gases is usually measured in tonnes of carbon dioxide equivalents (tCO2e). A carbon dioxide equivalent is a unit of measurement that describes the volume of carbon dioxide that has the same GWP (Global Warming Potential) as a specific mix of other greenhouse gases. For instance, methane is equivalent to (CH₄) 28 CO2 equivalents and nitrogen oxide (N₂O) to 265 CO2 equivalents.

**The calculators of Eimskip, Samskip, Icelandair, Pier2Pier.com and sea-distances.org are used to calculate the estimated CO2e.

The proportion of fishmeal and fish oil in the total export was 78% during the year, or 20,032 tonnes of products. The carbon footprint of the products was 970 tonnes of CO2 equivalent or 58% of total emissions.

The portion of frozen pelagic products was 22% of the total exported volume of products or 5,695 tonnes. The carbon footprint of the products was 713 tonnes of CO2 equivalent or 42% of total emissions.

It is clear that the export of fishmeal and fish oil has, on average, a lower carbon footprint than the export of frozen pelagic products.

CARBON FOOTPRINT BY MAIN PELAGIC SPECIES

Name Quantity tonnes Quantity kg % tCO2e CO2e % kgCO2e pr.tonnes prooduct
Blue Whiting 10.373 40,3% 414 24,6% 40
Mackerel 9.019 35,1% 719 42,7% 80
Herring 6.335 24,6% 550 32,7% 87
Total 25.726 100% 1.684 100% 65

*The table shows average calculations per kg CO2 equivalents of total volume of exported pelagic fish. The carbon footprint of individual species is determined by different processing methods, transport methods, delivery terms and market areas. It is important to take these factors into account when concluding results based on figures published here and comparisons between years.

**The calculators of Eimskip, Samskip, Icelandair, Pier2Pier.com and sea-distances.org are used to calculate the estimated CO2e.

When we look at the carbon footprint of the transport of individual fish species, the largest carbon footprint is due to the transport of mackerel, then herring and finally blue whiting. If the carbon footprint of the transport of these species is calculated for each kg CO2 equivalents per tonnes of product, it becomes clear that herring accounts for an average of 87 kg, mackerel for 80 kg and blue whiting for 40 kg.

The export of 25,727 tonnes of Brim’s pelagic products emits, on average, approximately 65 kg of CO2 equivalents per tonne of product.

INTERESTING FACT!
The total emissions of all the company's vessels during the year were over 64 thousand tonnes of CO2 equivalents. The portion of emissions from ships is therefore 82% of the company's total carbon footprint.

ENVIRONMENTAL STATEMENT

Work has been ongoing since 2015 to add new emission information from the company's operations to track the company's carbon footprint. With Brim’s environmental statement for the year 2020, the company comes very close to showing total carbon emissions due to its operations for the year.

Due to this additional information that has been added every year, it should be noted that a comparison of the company's total carbon emissions between years can give a wrong picture of the development. In this instance, it would be more appropriate to review only the items that appear in the attached environmental statement and go back to the year 2017.

This year's environmental statement now reports for the third time on emissions due to refrigerants, travel of employees to and from work in Reykjavík and business travel in Iceland and abroad.

The environmental statement for the year 2020 now reports for the first time on carbon emissions due to:

  • Export of frozen pelagic products as well as fishmeal and fish oil. In the previous year, for the first time, information was presented on emissions from exports of the company's groundfish products.
  • Domestic transport of fish products as well as other transport of goods by the company throughout Iceland.
  • Import of all packaging for the company's land processing and freezer trawler processing.

This year, Brim set up its own environmental database, where carbon emissions from operational data from the operations are calculated according to different definitions for different aspects of the operations. The presentation of data is based on the Green House Gas Protocol methodology, which focusses on linking it to the Global Reporting Initiative (GRI) and the Environmental, Social and Governance (ESG Reporting Guide) standards.

EFLA Engineering was commissioned to review the presentation and verify information on environmental aspects of Brim’s social statement and confirms with its signature that it provides correct information on the company's environmental impact for the 2020 operating year.

Attached is the surveyor's statement:

External Reviewer Declarations

GREENHOUSE GAS EMISSIONS 2020 BREAKDOWN INTO SCOPE 1, 2 AND 3

Scope 1 tCO2e %
Freezer trawlers 27.168 34.8
Pelagic vessels 20.799 26.7
Wetfish trawlers 16.216 20.8
Refrigerants 2.834 3.6
Fishmeal plants 1.327 1.7
Vehicles and machinery 120 0.2
Total 68.463 87.8
Scope 2
Electricity 524 0,7
Scope 3
Transport of groundfish products 5.842 7.5
Transport of pelagic products 1.683 2.2
Waste 728 0.9
Domestic transport 340 0.4
Transport of packaging and other supplies 197 0.3
Travel of employees in Reykjavík 144 0.2
Business travel 38 0.0
Total 8.973 11.5
Scope 1, 2 and 3 in total 77.960 100

COMPARISON BETWEEN YEARS

In the environmental statement below, there is a comparison between years of the main aspects of environmental issues at Brim. The comparison between years must be taken with the proviso that criteria have been added annually to obtain the best possible overview of the company's carbon settlement.


Unit 2020 2019 2018 2017
E1. Greenhouse gas emissions
Scope 1 tCO2e 68.463 66.201 62.983 59.340
Scope 2 tCO2e 524 564 686 696
Scope 3 tCO2e 8.973 4.513 488 162
Total carbon footprint tCO2e 77.960 71.278 64.156 60.198
E2. Greenhouse gas emission intensity
Energy emission intensity kg/CO2e/MWh 218 203 194 187
Employee emission intensity tCO2e/full-time equivalent positions 86 80 81 72
Emission intensity per square meter kgCO2e/m2 1.113 1.174 1.152 1.014
Total emission intensity of total revenue tCO2e/m.eur 226 244 296 277
E3. Energy use
Energy due to the use of fossil fuels kWh 239.483.301 249.982.922 244.186.930 243.089.969
Electricity use kWh 49.065.946 50.231.379 64.333.016 62.907.370
Energy from hot water for central heating kWh 14.693.256 13.866.060 13.608.598 16.155.210
Total renewable energy use kWh 303.242.503 314.080.361 322.128.544 322.152.549
E4. Energy intensity
Employees kWh/full-time equivalent positions 394.334 393.584 416.725 383.972
Total revenue kWh/m.eur 1.037.081 1.201.991 1.528.849 1.482.524
Square meter kWh/m2 5.106 5.798 5.946 5.424
Catches kWh/caught tonnes 2.369 2.251 1.928 2.113
E5. Composition of energy
Vessel fuel use liters 22.518.645 21.754.487 21.301.291 19.792.119
Fuel use of fishmeal plants liters 463.683 347.982 973.444 1.052.625
Fuel use of cars and equipment liters 44.430 47.861 42.179 60.313
Total fossil fuels liters 23.026.758 22.150.330 22.316.914 20.905.057
Fossil fuels % 79,0% 79.6% 75.8% 75.5%
Renewable energy % 21.0% 20.4% 24.2% 24.5%
E6. Use of potable water
Cold water 377.301 611.470 758.932 732.605
Hot water 253.332 239.070 234.631 278.538
Total water use 630.633 850.540 993.563 1.011.143
E7. Environmental operations
Does the company adhere a formal environmental policy yes/no yes yes yes yes
Does the company adhere to a special waste, water, energy and/or recycling policy yes/no yes yes yes yes
Does the company use an approved energy management system yes/no yes yes yes yes
E8. Climate monitoring by the Board
Does the Board oversee/or manage climate-related risks? yes/no yes yes yes yes
E9. Climate monitoring by management
Does the Executive Board oversee/or manage climate-related risks? yes/no yes yes yes yes
E10. Climate-risk mitigation
Investment in climate related infrastructure and product development Thousand króna. 486.388 78.825 429.493 209.546

WASTE MANAGEMENT

Unit 2020 2019 2018 2017
Total volume of waste kg 1.688.805 1.028.549 986.414 1.126.673
Construction waste kg 642.635 49.982 39.510 159.820
Organic waste from production processes kg 70.514 40.212 144.558 131.186
General waste from operations kg 975.656 938.355 802.346 835.667
Whereof sorted waste kg 797.779 740.775 609.249 652.603
Whereof for recycling kg 632.877 553.618 505.129 591.120
Whereof unsorted waste kg 177.877 197.580 193.097 183.064
General operations waste to landfill kg 342.779 384.737 297.217 244.547
Proportion of sorted waste from operations % 82% 79% 76% 78%
Proportion of recycled operations waste % 65% 59% 63% 71%
Total waste disposal tCO2e 728
Whereof construction waste tCO2e 171
Whereof general waste from operations tCO2e 465
Whereof organic waste from production processes tCO2e 92
Waste intensity
Employees tonnes/full-time equivalent position 2,20 1.29 1.28 1.34
Revenue (KPi2) tonnes/m.eur 3,34 3.59 3.81 3.85

PAPER HANDLING

Unit 2020 2019 2018 2017
Weight of printed paper kg 654 831 866 919
Total volume of printed paper pages 131.128 166.642 173.656 184.275
Whereof colour printed % 57% 56% 58% 71%
Whereof black/white printed % 43% 44% 42% 29%
Whereof printed on both sides % 29% 28% 29% 23%

CATCHES AND FUEL USE

Unit 2020 2019 2018 2017
Catches
Wetfish trawler catches tonnes 19.177 22.410 29.302 24.140
Pelagic vessel catches tonnes 81.582 88.725 119.950 109.281
Freezer trawler catches tonnes 27.269 28.378 17.836 19.039
Total catches tonnes 128.028 139.513 167.088 152.460
Fleet fuel use
Wetfish trawler fuel use litres 5.689.281 5.650.710 6.796.681 5.956.214
     There of scientific expeditions litres 298.068 372.498
     Fuel use / caught tonnes (CT) litres/CT 281 236 232 247
     GHG emissions of wetfish trawlers tCO2e 16.216 16.113 18.865 16.221
     GHG emissions / caught tonnes (CT) tCO2e/CT 0.80 0.67 0.64 0.67
Fuel use of pelagic vessels litres 7.297.512 6.144.762 8.194.585 6.463.549
      Fuel use / caught tonnes (CT) litres/CT 89 69 68 59
     GHG emissions from pelagic vessels tCO2e 20.799 17.288 22.746 18.356
     GHG emissions / caught tonnes (CT) tCO2e/CT 0,25 0.19 0.19 0.17
Freezer trawler fuel use litres 9.531.852 9.959.015 6.310.025 7.372.356
     Fuel use / caught tonnes (CT) litres/CT 350 351 354 387
     GHG emission of freezer trawlers tCO2e 27.168 28.392 17.515 20.525
     GHG emissions / caught tonnes (CT) tCO2e/CT 1.00 1.00 0.98 1.08
Total fleet fuel use litres 22.518.645 21.754.487 21.301.291 19.792.119
Total fleet GHG emission tCO2e 64.183 61.793 59.126 55.102

BUSINESS TRAVEL

Unit 2020 2019 2018 2017
Business travel
Air travel tCO2e 24 90
Rental cars tCO2e 14 15
Total tCO2e 38 105

TRANSPORTATION OF PACKAGING

Packaging Unit 2020 2019 2018 2017
Purchased wooden and plastic pallets for products tCO2e 103 100 75
Packaging use in processing plants and freezer trawlers tCO2e 94

KEY NUMBERS

Unit 2020 2019 2018 2017
Key figures
Total turnover m € 292 261 211 217
Number of man-years No. of man-years 769 798 773 839
Carbon tax ISK million 263 226 197 127
Investment in sustainability ISK million 486 79 429 210
Number of structures no. 25 23 23 26
     Size of structures m2 59.394 54.174 54.172 59.394
Number of vessels in operation on average during year no. 8 8 8 9
     Whereof wetfish trawlers - 3 3 4 4
    Whereof freezer trawlers - 3 3 2 3
    Whereof pelagic vessels - 2 2 2 2
Number of vehicles no. 21 22 22 20
    Whereof electric cars - 3 3 3 3
    Whereof hybrid cars - 2 1 3 2
Violations of environmental laws yes/no no no no no
Environmental management system yes/no yes yes yes yes
Agreements containing provisions on environmental issues no. 19 17 17 13

Nasdaq's ESG Reporting Guidelines are intended to disclose information on the above aspects of corporate operations to investors and other stakeholders, in a clear and accessible manner.